S&P 500 and Nasdaq: Nasdaq in an attempt to consolidate
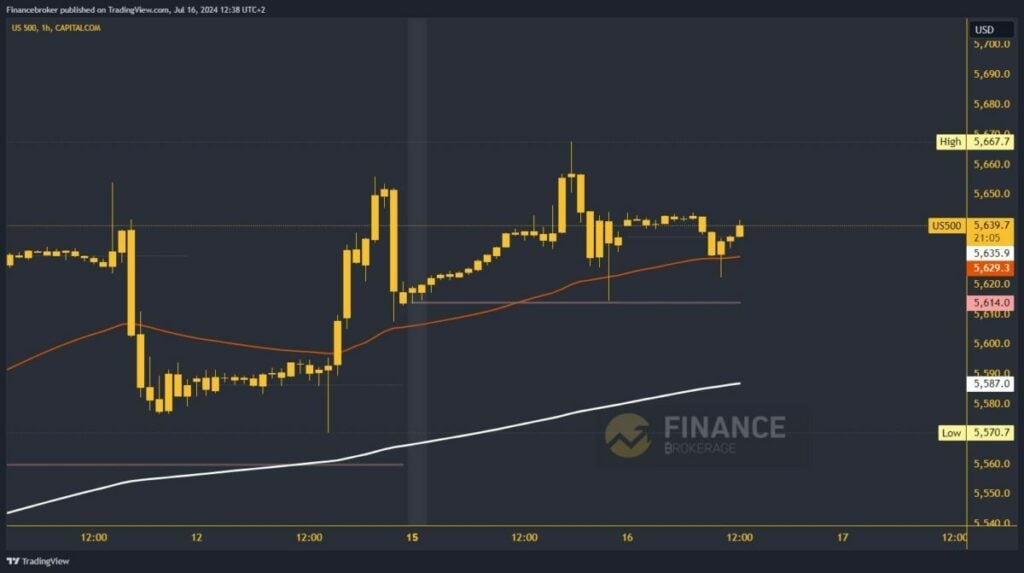
- On Monday, the S&P 500 index climbed to a new all-time high of 5667.7 level.
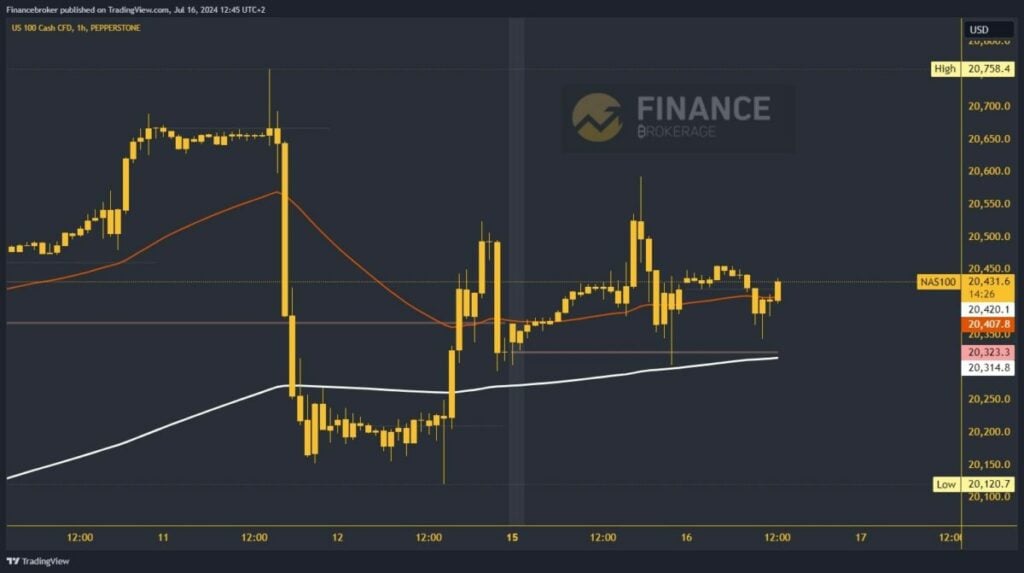
- The Nasdaq index is slowly recovering from last Friday’s drop to the 20120.7 level.
On Monday, the S&P 500 index climbed to a new all-time high of 5667.7 level. After that, the index stopped there and returned to retest weekly open prices. After a successful retest, we watched a move around 5640.0 during the Asian session this morning. In the EU session, we have a shorter pullback to 5620.0 and the EMA 50 moving average. From there, we see the initiation of a bullish consolidation and a return to the 5640.0 level. The index is in a slight bullish surge and could soon be above the 5650.0 level.
Potential higher targets are the 5660.0 and 5670.0 levels. For a bearish option, we need a negative consolidation and a new pullback to the 5620.0 level. We are close to testing support at the weekly open price. The S&P 500 index could initiate a deeper pullback if it does not hold there. Potential lower targets are 5610.0 and 5600.0.

Nasdaq chart analysis
The Nasdaq index is slowly recovering from last Friday’s drop to the 20120.7 level. This week, we are mainly looking at sideways consolidation in the 20300.0-20550.0 range. This morning, we retested the bottom line of this range. Now, we see a slight bullish consolidation up to the 20430.0 level. We need to continue this consolidation to climb to the upper line at the 20550.0 level.
If we manage to stay up there, we will have the opportunity to start further growth on the bullish side with a new impulse. Potential higher targets are the 20600.0 and 20650.0 levels. For a bearish option, we need a pullback down to the 20300.0 level. There, we meet the EMA 200 moving average. The impulse below will create a new weekly low. Potential lower targets are the 20250.0 and 20200.0 levels.

The post S&P 500 and Nasdaq: Nasdaq in an attempt to consolidate appeared first on FinanceBrokerage.


