Solana and Cardano: Solana encounters resistance at $167.00
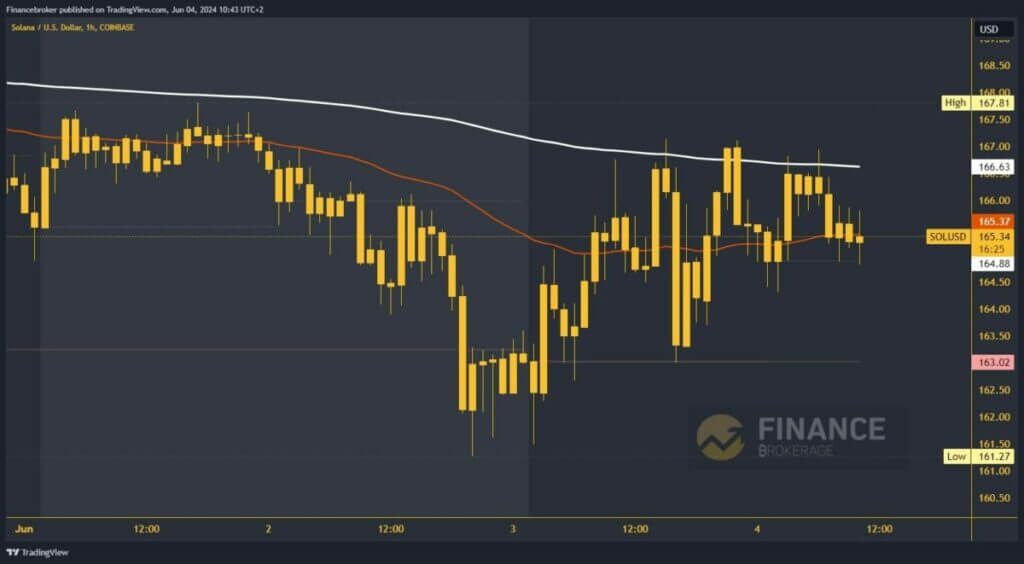
- On Sunday evening, the price of Solana retreated to the $161.27 level.
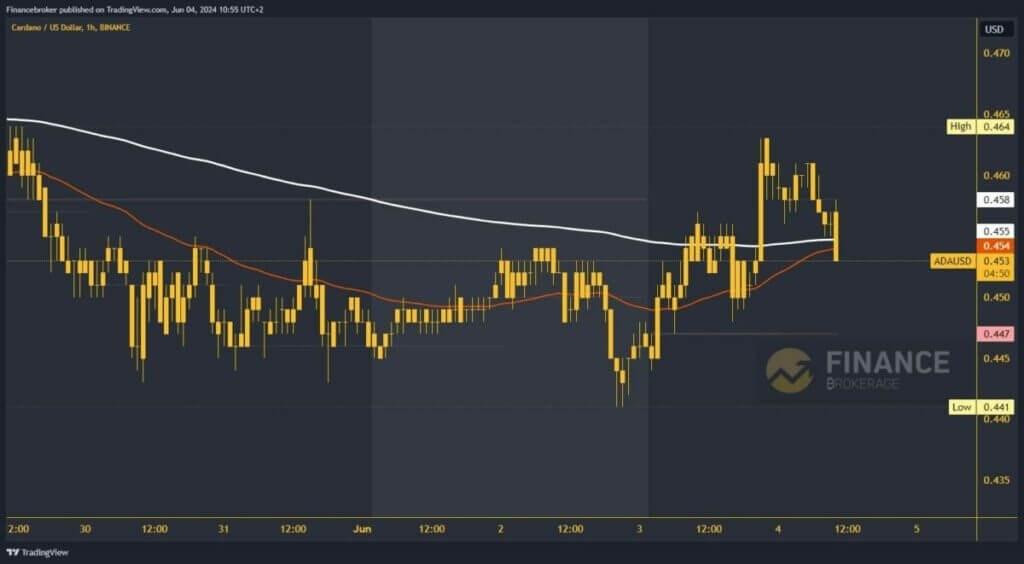
- The new weekly high price of Cardano was formed last night at the 0.464 level.
Solana chart analysis
On Sunday evening, the price of Solana retreated to the $161.27 level. However, we observed a stabilization at that level and the start of a recovery above the $163.00 level. On Monday, the price took a step up to the $167.00 level, forming a new weekly high there. It’s worth noting that in this zone, we encountered the EMA200 moving average, a significant indicator that is currently influencing the market dynamics and preventing us from moving above it for now.
Potential higher targets are $167.50 and $168.00 levels. However, it’s crucial to note that a pullback below today’s support and the $164.00 level could signal a bearish option. This would shift our perspective to the bearish side and potentially lead to a new pullback to the previous support. Therefore, these levels at $164.00 and $163.00 are key to watch.

Cardano chart analysis
The new weekly high price of Cardano was formed last night at the 0.464 level. After that, we stop there, and initiate a pullback down to the EMA200 moving average. Now, we are under new pressure that could push us to a new low and thus confirm that we are about to move to the bearish side. Potential lower targets are 0.450 and 0.445 levels.
We need positive consolidation and maintenance above EMA200 and 0.455 for a bullish option. If we succeed in this, we will have a solid bottom from which we will continue with further recovery to the bullish side. Potential higher targets are 0.460 and 0.465 levels. The growth of Cardano above 0.465 will lead to the formation of a new weekly high and thereby strengthen the bullish option.

The post Solana and Cardano: Solana encounters resistance at $167.00 appeared first on FinanceBrokerage.


